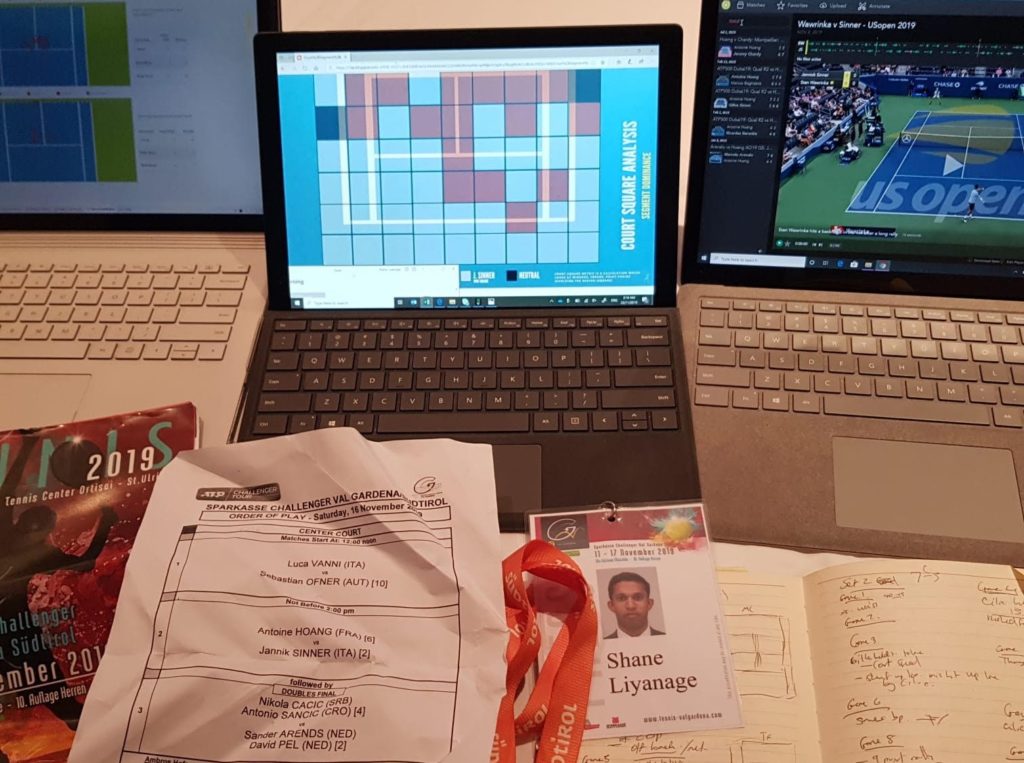
Photo: Shane Liyanage
In terms of use, a tennis ball is no different from a baseball, golf ball, hockey puck, basketball or football—the round or the oval kind.
Athletes wield them to score points but also to better their personal records and, by the same token, the salaries they rake in.
To get a raise, they may try to boost their stats—common benchmarks that have always existed—but, in the past two decades or so, significant advances have made sports data science a field in which a lot of people want to graduate, especially league and team managers and athletes themselves.
Enter the wide world of sports analytics.
Data let tennis players know which of their crosscourt forehand, slice backhand down the line or wide serve in the ad court is their most effective weapon, who to run down because they don’t do well in long rallies, which shots they rely on the most and who has trouble changing direction or getting off to a quick start.

To build a proper database, it takes thousands of matches viewed by dedicated analysts.
Montrealer Sébastien Lavoie is one of them. He’s a contributor at Data Driven Sports Analytics (DDSA). Founded five years ago by Shane Liyanage, the Australian firm’s slogan is The numbers don’t lie.
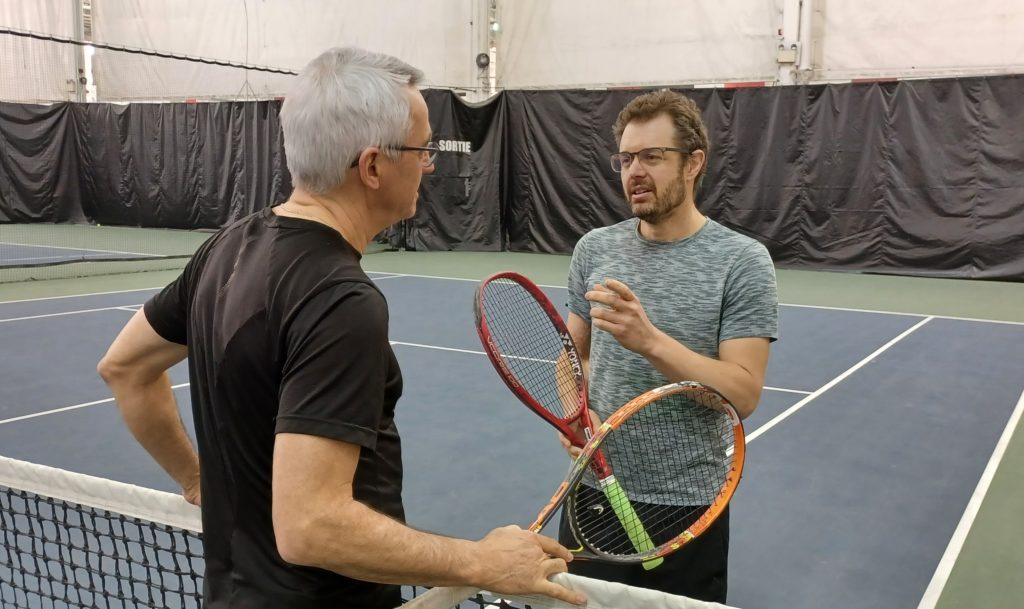
I also found out firsthand that Lavoie is a solid tennis player. So, he knows his stuff.
That said, numbers and statistics are his passion, and he was happy to shed some light on tennis analytics to explain their ins and outs and especially their benefits.
DDSA’s clients include Aryna Sabalenka of Belarus and Ons Jabeur of Tunisia, as well as promising Finn Emil Ruusuvuori and veterans Taro Daniel (Japan), Albert Ramos-Vinolas (Spain) and Thomas Fabbiano (Italy). More players are bound to join DDSA and the other companies that have rapidly emerged in the past 20 years.
I’ll take a bit of a detour to revisit the context in which many of us first heard about the use of advanced stats in sports.
MONEYBALL
Whenever a sports organization or league boasts about their use of big data, most people think of the Oakland A’s, where it all began.
Back in 2002, former player and A’s general manager Billy Beane applied a statistical analysis method known as sabermetrics that turned the draft assessment system on its head in an effort to reduce the team’s payroll. In 2006, he’d managed to build the fifth-best team in Major League Baseball while keeping the Athletics ranked 24th of 30 teams in terms of total salary.
Huge.
The revolution even inspired Michael Lewis’ book Moneyball: The Art of Winning an Unfair Game, which was later made into a movie that earned 14 award nominations, including Academy Awards (but didn’t win any).
Regardless, the trend caught on, and tennis entered the fray around 2015.
HOW DOES IT WORK?

Shane Liyanage, who founded DDSA, is a data scientist and former high-level player in Australia. He capitalized on current technological capabilities to develop an efficient method that draws the best out of the physical, mental and tactical aspects of the sport.
Sébastien Lavoie explains how tennis and analytics go hand-in-hand, since there are only two athletes on a relatively small surface whose every square metre is captured by cameras like Hawk-Eye. “You get an exact reference in terms of the trajectory of the ball on every shot and a better understanding of its position on the court, regardless of whether it’s at the beginning of the point, on serve or return, or at any other moment in the rally. The information enables players to better understand themselves and confirm or refute the trends noted by the coach—two ways to better target fixes.”
The knowledge they provide makes data a great tool to prepare players for their opponents, like knowing your rival tends to open games with a wide serve on the deuce side.
Although they don’t always admit it, most top players rely on data. “For their own development and for optimal preparation at every stop on the tennis calendar. For our clients, what’s most important is to know what strategy to adopt in their next match. If a client has played the opponent in the past, we have the data. Otherwise, we’ll compile statistics from the opponent’s last ten matches on the surface to isolate trends our client can then take advantage of.”
Even fans with the wildest imaginations have absolutely no idea how much data is collected to improve players’ games and detect their rivals’ slightest flaws.
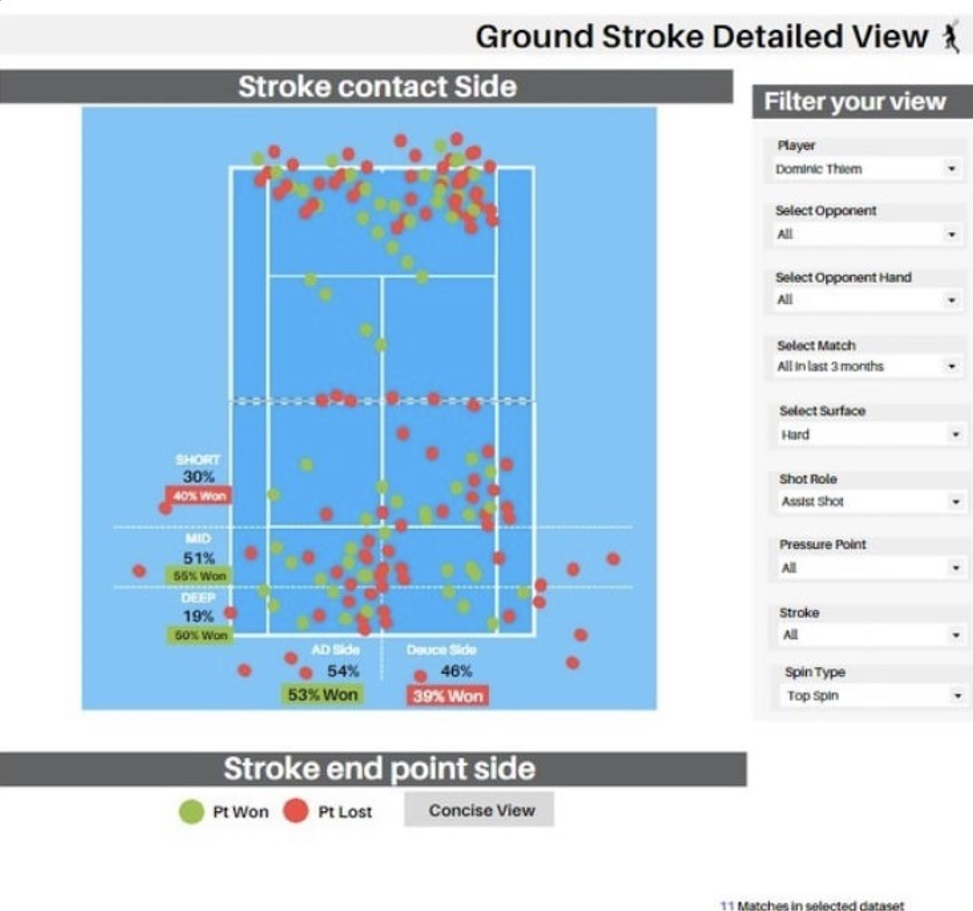
Here are three DDSA charts for Serena Williams. You’ll want to sit down for these, since you may start feeling a little dizzy.
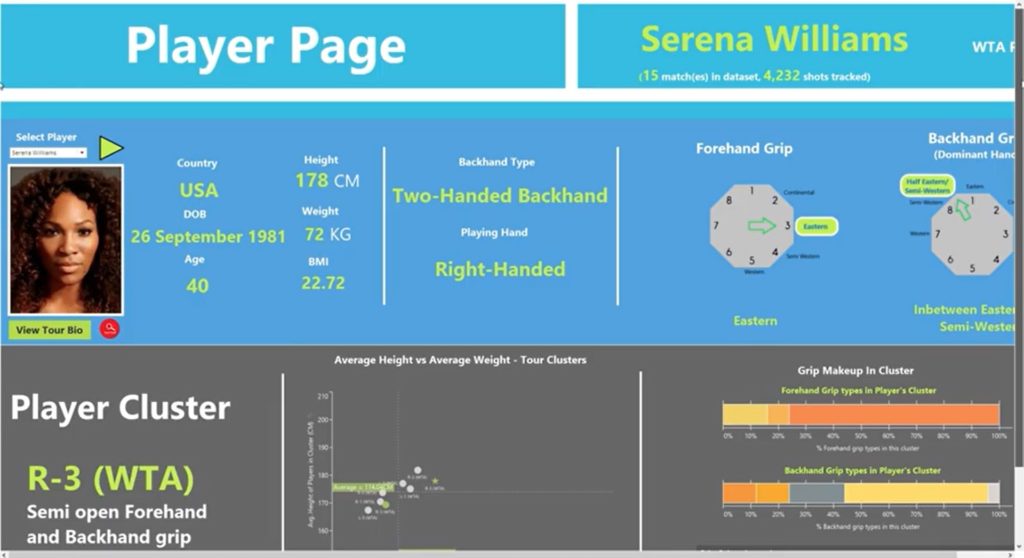
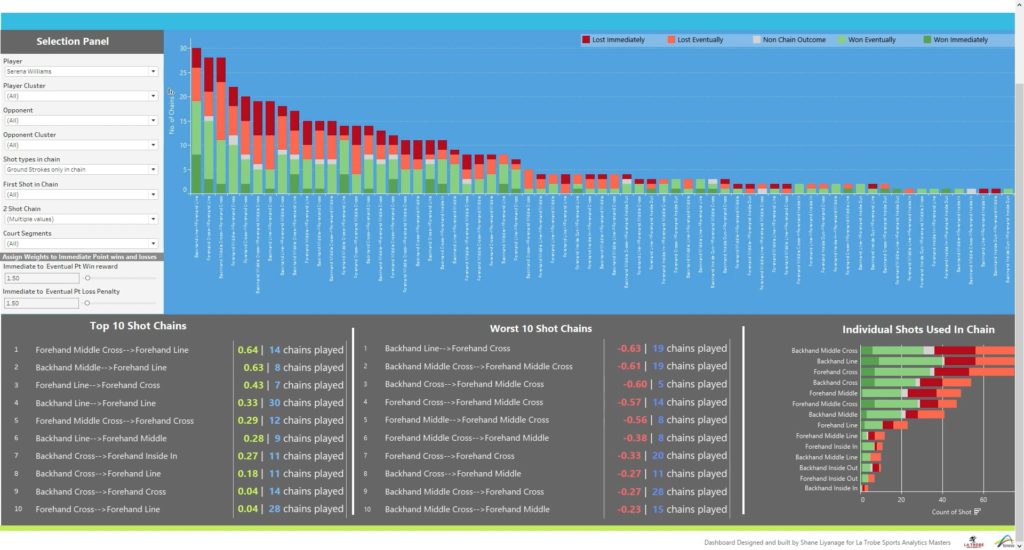
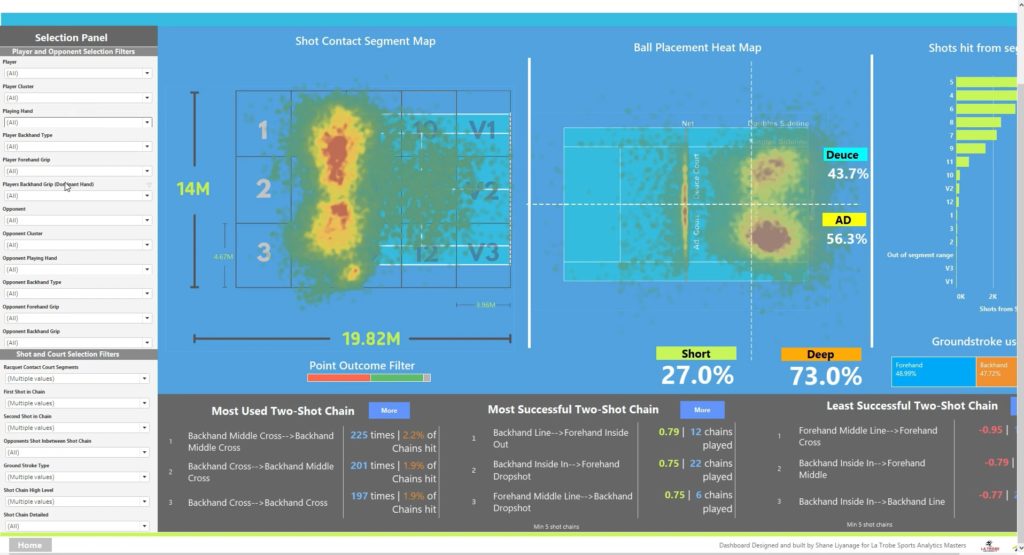
Advanced statistics come from several sources and are available through many businesses. I asked Sébastien Lavoie what DDSA does to gather as many player data as possible. Do they buy them? Compile them?
“Option 2. We can get video of a lot of WTA and ATP matches through our distribution channels or national entities like Tennis Australia. We do some quick viewing of the matches involving a given player using software we developed. It isn’t as accurate as Hawk-Eye, but it still enables us to identify obvious trends once the shots are compiled. We then classify each video and the statistics we extracted to build our own data bank. For example, we have more than 500 junior, US college and Challenger matches and more than 2,000 WTA and ATP match in our database. All in all, we must have close to 8,000 matches.”
Sounds like a painstaking task.
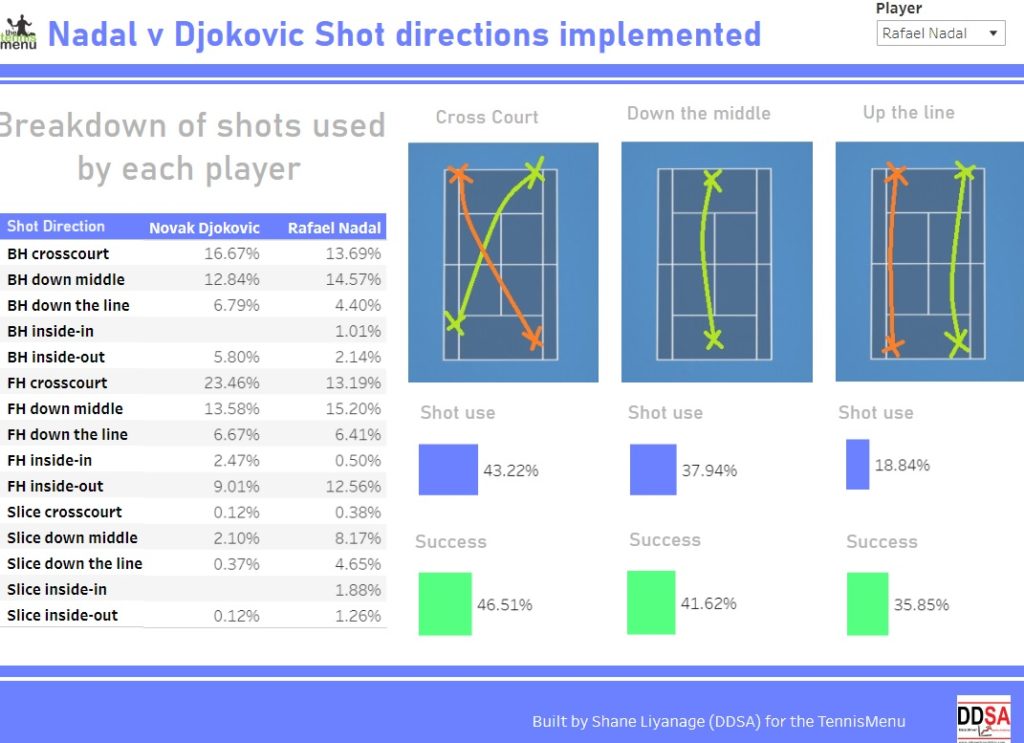
It comes as no surprise that some of the firms’ clients would be junior players 8 to 10 years old (!) and college players. While the younger ones work on improving their game, the older ones look for opponent analyses.
“You know how much money is involved at the college level. The stakes are already high, so what we need to deliver is two-fold: you want to know how to improve an athlete’s performance and you want to know their rivals’ weaknesses. For example, for the past two years, players like Liam Draxl, Gabriel Diallo, Alexis Galarneau, Layne Sleeth and Carson Branstine, who have shined in the US, have had access to tools we couldn’t have imagined 15 years ago,” Sébastien explained.
I ask him a simple question.
Take two players. One has a coach who analyzes strengths and weaknesses and provides advice on ways to improve without any technological input. Does the other player, who uses analytics, have an edge?
“There are too many variables to give a percentage, whether it’s 2%, 5% or 10% advantage. Women, men, surface, schedule, etc. But it’s clear that the data give additional information that will be extremely useful for the player’s progress. Analytics are part of a cohesive approach with the coach, whose human assessment qualities and experience will be complemented by these beneficial data. And our relationship is with the coach, not the player. It’s up to the coach to use the data and integrate them into recommendations during practice and in competition.”
TENNIS CANADA, TOO
In early 2022, DDSA worked with Tennis Canada during Billie Jean King Cup. The main goal was to establish a game style for each player from Latvia, based on advanced statistics.
Jocelyn Robichaud, head of U15 development at Tennis Canada, confirmed the company’s interest and believes 2023 is the target year to jump on the analytics train at full speed.
“It’s inevitable. Everyone will eventually get on board,” said Robichaud. “Right now, we don’t have enough staff to have someone on a full-time basis, so it’s only normal we’d get support from specialized external firms.”

Tennis Canada already compiles records on every Canadian player, including strength, power and endurance analyses for information on each individual’s physical abilities and psychological evaluations.
“But the only data we have on the technical details of their performances, movement and tennis sense are derived from basic match statistics and input from their coaches. We’d obviously like to have a much more accurate technical and tactical profile of each player,” he added. “When we can do that systematically, we can start building complete profiles for each of our athletes from the time they’re 10 or 12 years old. Then, in the development process, we’ll have comparisons to determine improvement curves after three, four or five years to optimize their development.”
Analytics won’t turn tennis into a video game, but there are matches in which they could make a difference, like in a long and drawn-out battle between players separated by only a tiny margin.
For example, on July 15, Lesia Tsurenko defeated Kamilla Rakhimova, 6-7 (1), 6-4, 7-5 on clay in Budapest. At the outcome of the WTA’s longest match of the season thus far (3:53), Rakhimova had one point more than Tsurenko. Indeed, out of 251 points, the loser amassed 126 and the winner 125.
Would better preparation, additional data and different tactics have given Rakhimova the upper hand?
There’s no telling, but why not secure every advantage?

